Today’s decisions regarding the management of water and energy are linked inextricably. A large amount of energy is required to collect, treat, and supply water, which means that thoughtful water management strategies can result in a significant reduction in energy use and greenhouse gas emissions. Global droughts in 2022 leading to water scarcity coupled with climate change have limited the availability of clean water and low-cost energy. California provides a striking example of climate whiplash, where we have recently seen both significant droughts and flooding (from atmospheric rivers); yet several areas of the state including the Colorado River basin (which feeds into seven states) are at historic low water-levels underscoring the need for creative solutions to infrastructure deficit. This blog reviews the energy used to derive potable water from sources such as surface, groundwater, recycled water, brackish water, and seawater, and evaluates how we can work towards decarbonizing water or minimizing the hydrocarbon footprint by shifting to renewable energy source(s) for electricity generation.
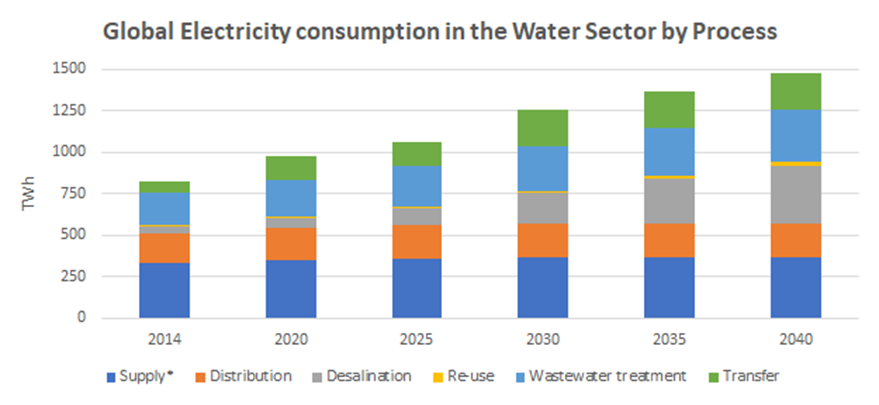
Figure 2: IEA, Electricity consumption in the water sector by process, 2014-2040 (chart recreated with data from IEA)
The chart above from the IEA illustrates that desalination sector will be the largest consumer of electricity in the water sector in the world through 2040. This is because of two reasons: (1) it is energy intensive, and (2) it is the most promising technique to clean the most abundantly available water – seawater.
In contrast, the U.S. electricity market generation is ~ 4 trillion kWh annually per U.S. EIA, with consumption in the water sector similar to that of the world. There are various estimates, but it appears that the water sector (excluding agriculture, but including wastewater) consumes ~ 4% of the overall electricity consumption in the U.S. (per EPRI).[i]
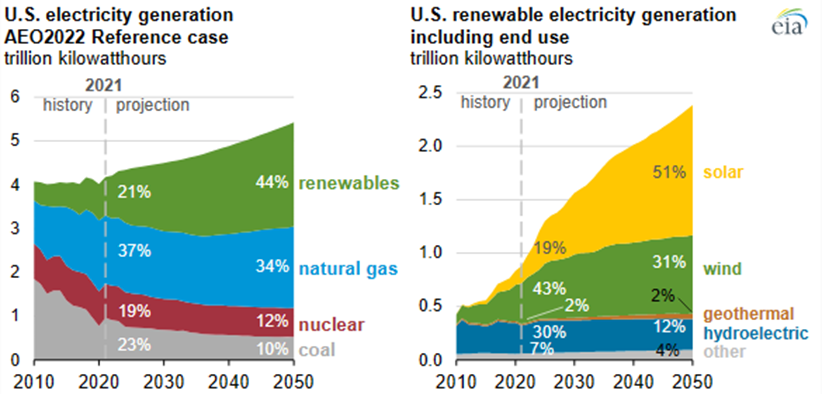
Figure 3: U.S. Electricity generation. Source: U.S. Energy Information Administration, Annual Energy Outlook, 2022 (AEO2022)
The carbon footprint of U.S. water is likely growing with growing demand (primarily industrial and commercial), climate change and its affects on freshwater sources. The adoption of more stringent water treatment levels at the state and federal level, e.g., adoption of UV treatment and ozonation (see my last blog on New York City Water, Can New York City manage its Clean Water? – Day Zero Water) will increase the energy and carbon costs of treating water and wastewater.
Water conservation, reuse, efficiency improvement are effective in lowering our energy and greenhouse gas footprint. Retrofitting water heaters and appliances can reduce hot water use by approximately 20%. Similarly reducing outdoor irrigation, rainwater harvesting, leak prevention can go a long way in reducing water consumption. The good news is that it is doable, and New York City has been a pioneer on water conservation. In the 25-year measurement period 1990-2015, NYC water demand decreased by approximately 30% despite a 19% population increase over the period[i]. This was achieved through a variety of water efficiency projects, retrofits, education, metering, gradual increase in water service charge in bills, water benchmarking, optimizing leak detection programs and optimizing pressure management.
The energy intensity of water supply depends on the type (surface water, groundwater, brackish water, recycled water, desalinated seawater), quality and location of water supply, e.g., gravity fed system will have de minimis energy intensity compared to a user whose water has to be pumped long distances over various topographies.
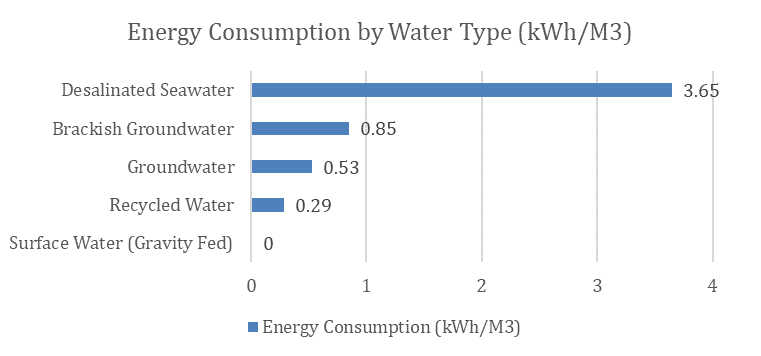
Figure 4: Specific Energy Consumption. Data source: The Carbon Footprint of Water, A River Network Report (Note: kWh/M3 is kilowatt hours per cubic meters of water)
While consumers may not be able to influence the energy intensity of the water, they can play a significant part in reducing the carbon footprint on a personal level (installing energy efficiency devices, retrofitting water heating devices to be more energy efficient, switching gas water heater to electric, installing solar panels, investing in battery storage, etc.) and regional level by spreading awareness and building support for various forms of renewable energy.
Intuitively, segregating water by use may be a helpful strategy to conserve water and lower the energy and carbon footprint. Clearly, we don’t need the same high-quality municipal water for irrigation, toilets, laundry machines. Yet, there are few options as apartment buildings and houses are built with just one water intake pipe bringing in clean water often regulated by building code, which should be revisited. Planners and building developers have started thinking about recycling water for irrigation and toilet use, which can be separated from clean drinking water (Note: An average household uses less than 10% of its water for drinking). There is significant amount of water and energy saving to be had with segregation. For example, the agriculture and power industry account for ~40% and 42%, respectively of water withdrawals in the U.S. These two industries could do well with recycled water and rainwater harvesting (instead of adhering to potable water standards) thereby reducing the stress on the water and energy industry. Also, using renewable energy can reduce the water required for electricity generation by power plants. Residents in Spain and other European countries rely primarily on bottled drinking water and use the municipal water supply (higher salt content than U.S. standards) for other household needs (cooking, kitchen, toilets, laundry, irrigation).
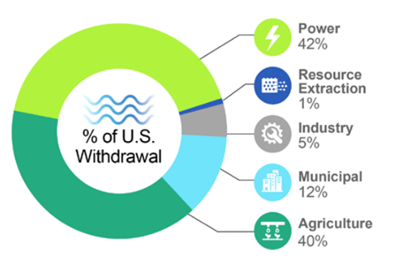
Figure 5: Overview of water withdrawals in the U.S. Source: NAWI (National Alliance for Water Innovation) Technology Roadmap 2021
It is not too farfetched to think that by 2030, there will be significant push and buy-in towards mandating rainwater harvesting, water reuse, renewable energy, and demand-side management of energy load (by type of energy source). New York is already talking about banning natural gas in new buildings in New York City. My parents’ hometown of Chandigarh, India has already mandated rainwater harvesting and solar energy in all new homes with a lot area exceeding 1/8th of an acre. Positive change is here, finally!
Levelized Cost of Energy
In comparing energy sources (solar vs. wind, nuclear, coal, etc.) for water treatment, it is best to do an apples-to-apples comparison to create a levelized playing field. The levelized cost of energy (LCOE) metric includes upfront capital costs, fuel and operations & maintenance costs, and cost of CO2 emissions (or carbon incentives required to break even). For example, electricity generated from wind/solar/nuclear is considered to be carbon-neutral vs. electricity from natural gas and coal.

Figure 6: Levelized Cost of Energy in $/MWh by energy source. Source: Energy Intelligence
The levelized costs of solar, wind and natural gas currently are $0.05/kWh, $0.05/kWh and $0.06-0.11/kWh (combined cycle vs. open cycle gas turbine), respectively (see Figure 6), which shows the effectiveness of renewable energy sources vs. fossil-fuel based energy. Apparently, the data above does not reflect the electrical utility delivery costs, which can exceed the supply cost (above) for residential users. In other words, the utility delivery cost can be as much as 30-70% of a residential user’s electricity bill (67% for my December electric bill!). Unfortunately, the U.S. power and natural gas utilities appear to be large and inefficient monopolies! Producing on-site renewable energy such as solar or geothermal can eliminate the significant delivery costs, reduce carbon footprint, and create self-sufficiency in a volatile commodity. We are in the midst of installing rooftop photovoltaic solar panels on my house and the payback period is estimated to be 6-7 years.
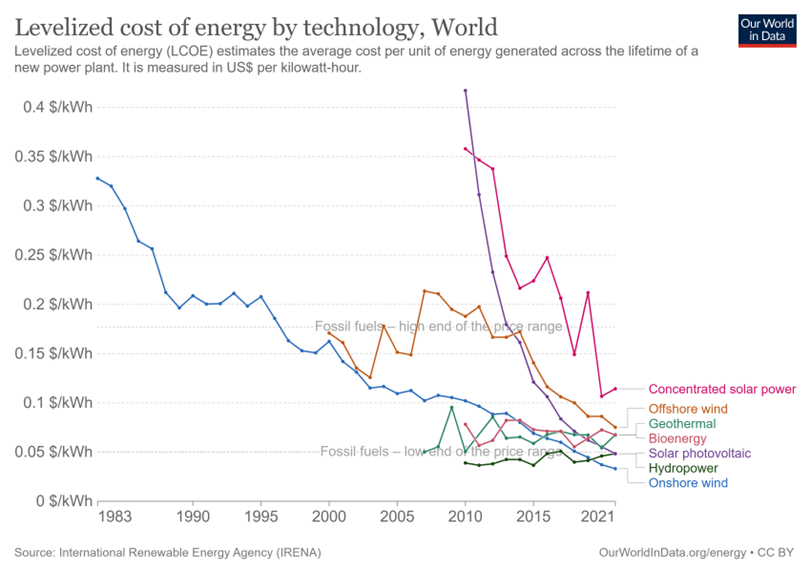
Figure 7: Levelized Cost of Energy by Technology in $/kWh by energy source. Source: International Renewable Energy Agency (IRENA)
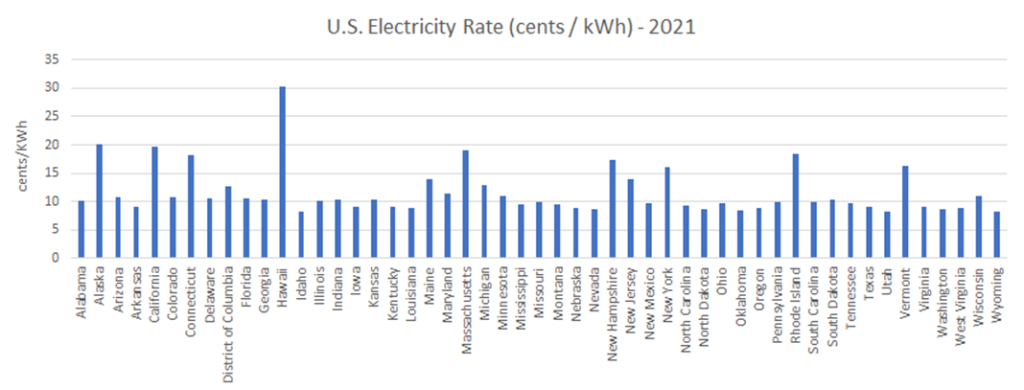
Figure 8: U.S. Electricity Rates by State. Data source: US Electricity Profile 2021 – U.S. Energy Information Administration (EIA)
Figures 7 above shows the LCOE by energy source in kWh for the World. The U.S. data for solar photovoltaic and wind power is very similar at ~ $0.05/kWh. Figure 8 shows electricity rates by state. The data above reveals that many forms of renewable energy such as solar, wind and hydropower have reached energy parity with natural gas. Infact, while the utility costs by state are increasing (2022 prices were ~20% above 2021 levels) renewable energy costs are declining. Unfortunately, supply chain snags, delays in getting connection to the utility grid, and regulatory permits appeared to have slowed down the rate of development of solar and wind projects in 2022. U.S. government needs bipartisan support to promote renewable energy.
Initiatives to decarbonize water at the water treatment plant level include:
- Harnessing renewable energy to reduce reliance on fossil-fuel based energy. Examples include using wind energy (e.g., ITC is using in Grand Canary Islands – see my visit blog), wave energy (France and UK have set up 240MW generating units[7]), and solar energy (e.g., Saudi Arabia’s push towards “carbon neutral” desalination plant for the futuristic city of Neom).
- Adopting a flexible modular-system approach for energy use. For example, ITC in Grand Canary Islands has set up several pilot-scale reverse osmosis units to treat seawater from various energy sources (fossil fuel, solar and wind) where the energy source for motive power can be changed. ITC has used Artificial Intelligence to manage the variable operation of a seawater reverse osmosis plant. Desalination systems can be further trained using Artificial Intelligence algorithms to switch between energy source (solar, geothermal, wind, etc.) based on inputs that impact cost and emissions (carbon footprint). In the U.S., while natural gas is currently the preferred energy source to generate electricity (accounting for 37% electricity generation per Figure 3), it is not a renewable energy source, and it is fair to seek legislating a premium to natural gas cost for parity among energy sources.
- Desalination plants are increasingly innovating and using energy recovery devices to reduce their carbon footprint. Specific Energy Consumption (measured in kWh/m3) has reduced from 8 kWh/m3 in the 1970s to approximately 2.5-3.0 kWh/m3 approaching the thermodynamic limit of 0.76 kWh/m3 for seawater reverse osmosis[8] (though still higher than surface water treatment plant energy consumption of 0.50 kWh/m3). This reduction in energy consumption is attributable to high efficiency pressure pumps, improvement in reverse osmosis membrane structure and use of energy recovery devices. For example, the Llobregat desalination plant in Barcelona (I visited in August) uses 230 energy recovery devices, which are estimated to reduce plant power consumption by 18 MW, saving 157+ GWh of energy per year and avoiding 92,900 tons of CO2 emissions per year.
As the world moves towards securing clean water, water desalination is seeing significant investments around the world (see my blog posts on water desalination plant visits at Day Zero Water – Discovering Pathways to Clean Water). These desalination plants based on reverse osmosis and/or thermal desalination are highly effective in purifying seawater or brackish water albeit energy intensive (which they try to mitigate through investment in energy recovery, and use of artificial intelligence to optimize operations and maintenance costs). Desalination plants are being deemed essential to counter water scarcity and provide diversification of water source. Since energy use can account for up to 30-40% of the cost of running a water treatment or desalination plant, there are many good reasons to minimize the carbon footprint of water treatment and water desalination plants.

Figure 9: Energy Recovery, Inc. and Global Clean Water Desalination Alliance
We can play a significant part in decarbonizing water, both at a personal level (installing energy efficiency devices, retrofitting water heating devices, solar panels, geothermal energy, etc.) and a regional level by spreading awareness and building support for various forms of renewable energy. These initiatives should lead us closer to the key point of COP 21 or the Paris Climate Conference, applicable to all countries, aiming to keep global warming at 1.5-2.0 °C.
References:
- The water consumption of energy production: an international comparison (iop.org)
- Introduction to the water-energy nexus – Analysis – IEA
- IEA, Paris https://www.iea.org/data-and-statistics/charts/electricity-consumption-in-the-water-sector-by-process-2014-2040, IEA. License: CC BY 4.0
- CarbonFootprintofWater-RiverNetwork-2009.pdf (csu.edu)
- NYC Water Demand Management Report June 2016, water-conservation-report2016.pdf (nyc.gov)
- Levelized cost of energy by technology, World (ourworldindata.org)
- Tidal giants – the world’s five biggest tidal power plants – Power Technology (power-technology.com)
- Thermodynamic perspective for the specific energy consumption of seawater desalination – ScienceDirect